The KOSPI has fallen 5% in a day 83 times since 1997. Here is what happened next
Every day the KOSPI closed at least 5% lower since 1997, grouped into 31 crash episodes and tracked one week, one month, three months and one year later against an ordinary day.
Key points
- Since 1997 the KOSPI has closed at least 5% below the previous close on 83 days. 21 of them came in 2026, against a previous high of 12 in 2000.
- Grouping back-to-back crashes gives 31 crash episodes. One month after the 30 completed episodes, the median KOSPI return was +5.6%, against +0.8% for an ordinary day.
- One year later the median was +18.1% against +6.4%, but the index was higher in 64% of cases, the same as on an ordinary day. Outcomes were bigger in both directions, not more reliably positive.
- The crash day was rarely the bottom. In 25 of 30 episodes the index closed lower again within 60 trading days.
- The biggest up days sat right next to the worst down days: 14 of the 20 best days since 1997 came within 10 trading days of a 5% crash.
Where the KOSPI stands
Korea’s benchmark index has had a year without precedent in our data. The KOSPI closed at 6,012.44 on October 28, 2026. That is 42.7% higher than at the end of 2025, and 34.0% below its record close of 9,114.55 on June 22.
The latest leg down began on October 13, when the index fell 5.46% to 6,035.35. Two sessions later, on October 15, it fell another 7.57%. It kept sliding to a close of 5,469.47 on October 26, 9.4% below the October 13 close, then rebounded 3.09% and 6.63% on the next two days.
So far this year the KOSPI has posted both the largest one-day fall since 1997 (-12.06% on March 4) and the largest one-day gain (+17.91% on July 31).
When a market moves like this, the question investors ask is whether a crash is a time to sell or a time to buy. This article does not answer that with a forecast. It goes back through every 5% down day since 1997 and measures what the index actually did next.
Method
- Data: KOSPI daily closes from December 1996 to October 28, 2026, about 7,350 trading days. This is the price index in Korean won. It excludes dividends and trading costs.
- Crash day: a close at least 5% below the previous trading day’s close. There are 83 since January 1997.
- Crash episode: crashes cluster, so counting each day separately would count the same event several times. A crash day starts a new episode only if there was no other crash day in the previous 20 trading days. That gives 31 episodes. The 31st began on October 13, 2026, and is still too recent to measure, so the results below use the 30 completed episodes.
- Forward returns: the change from the crash-day close to the close 5, 20, 60 and 250 trading days later (roughly one week, one month, three months and one year).
- Baseline: the same forward returns measured from every trading day since 1997. The index rose more than eightfold over the period, so buying on a random day usually worked. A crash only says something if the numbers after it beat that baseline.
2026 is the outlier
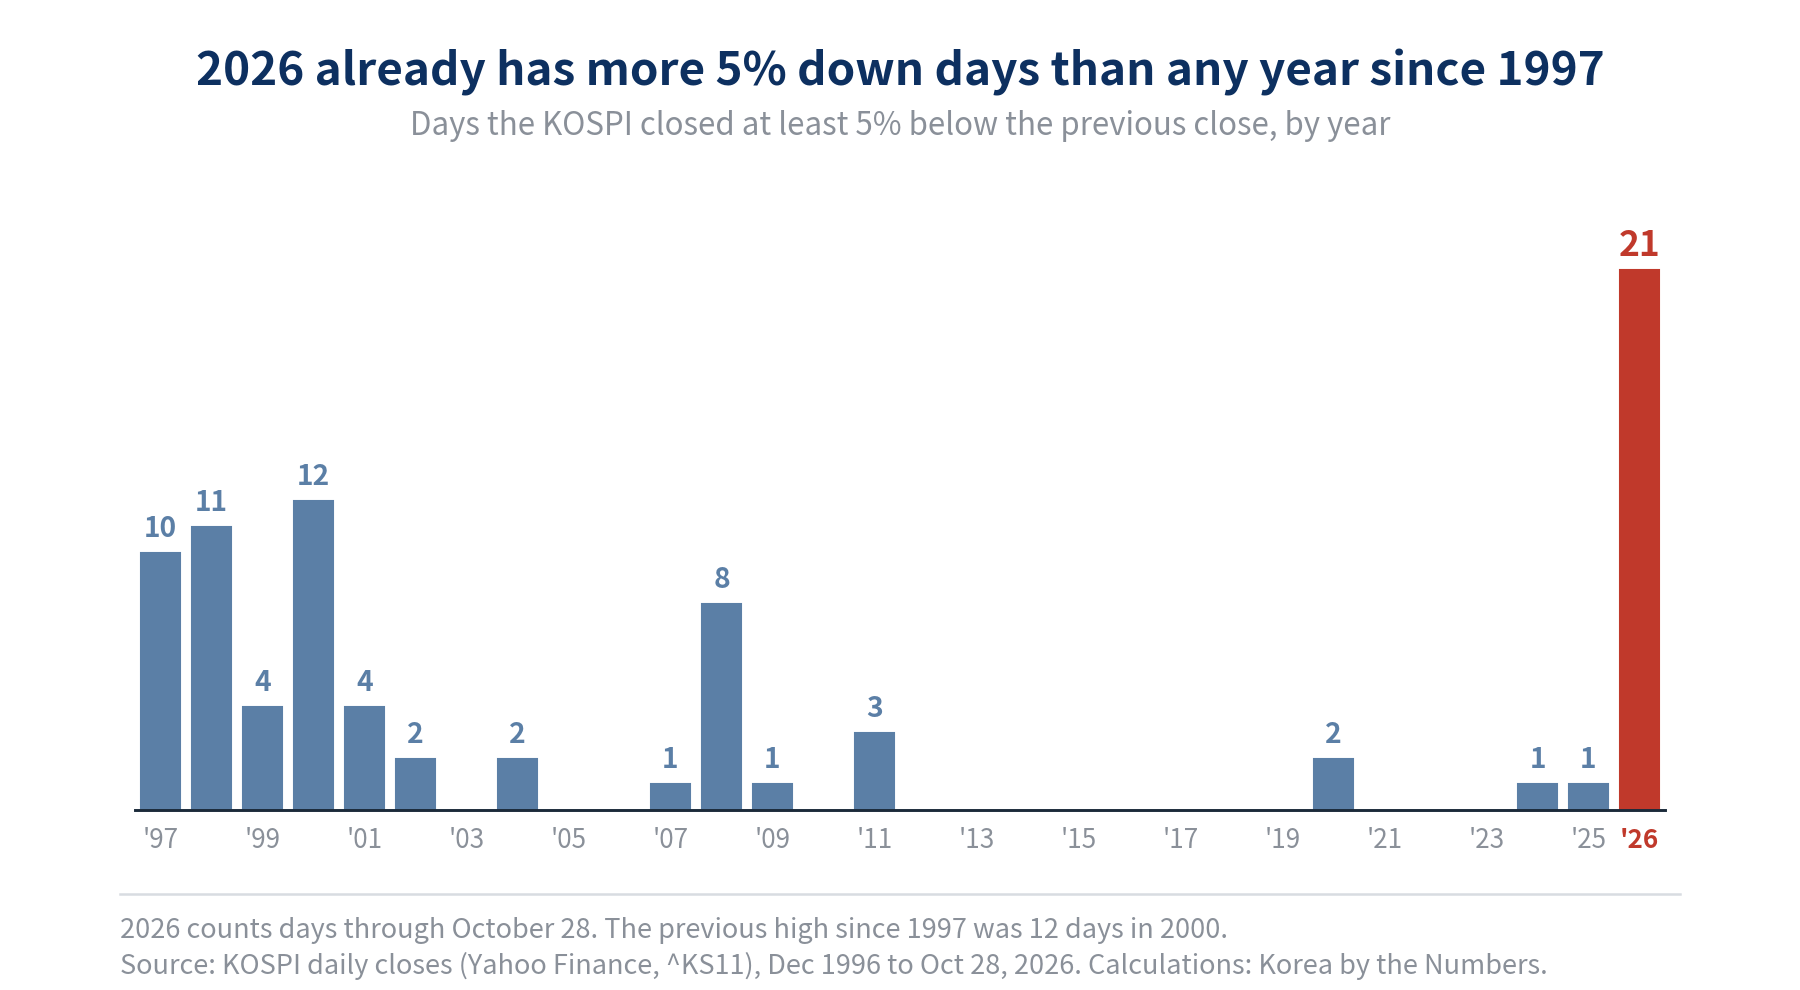
5% down days used to belong to crises. They clustered in the 1997 Asian financial crisis, the 2000 dot-com bust and the 2008 global financial crisis. From 2012 to 2019 there were none, and from 2020 to 2025 there were at most two a year.
2026 has had 21 through October 28. Keep that in mind for everything below: this year’s market is more volatile than any period in the sample, and history from calmer years may not transfer cleanly.
Did buying after a crash beat an ordinary day?
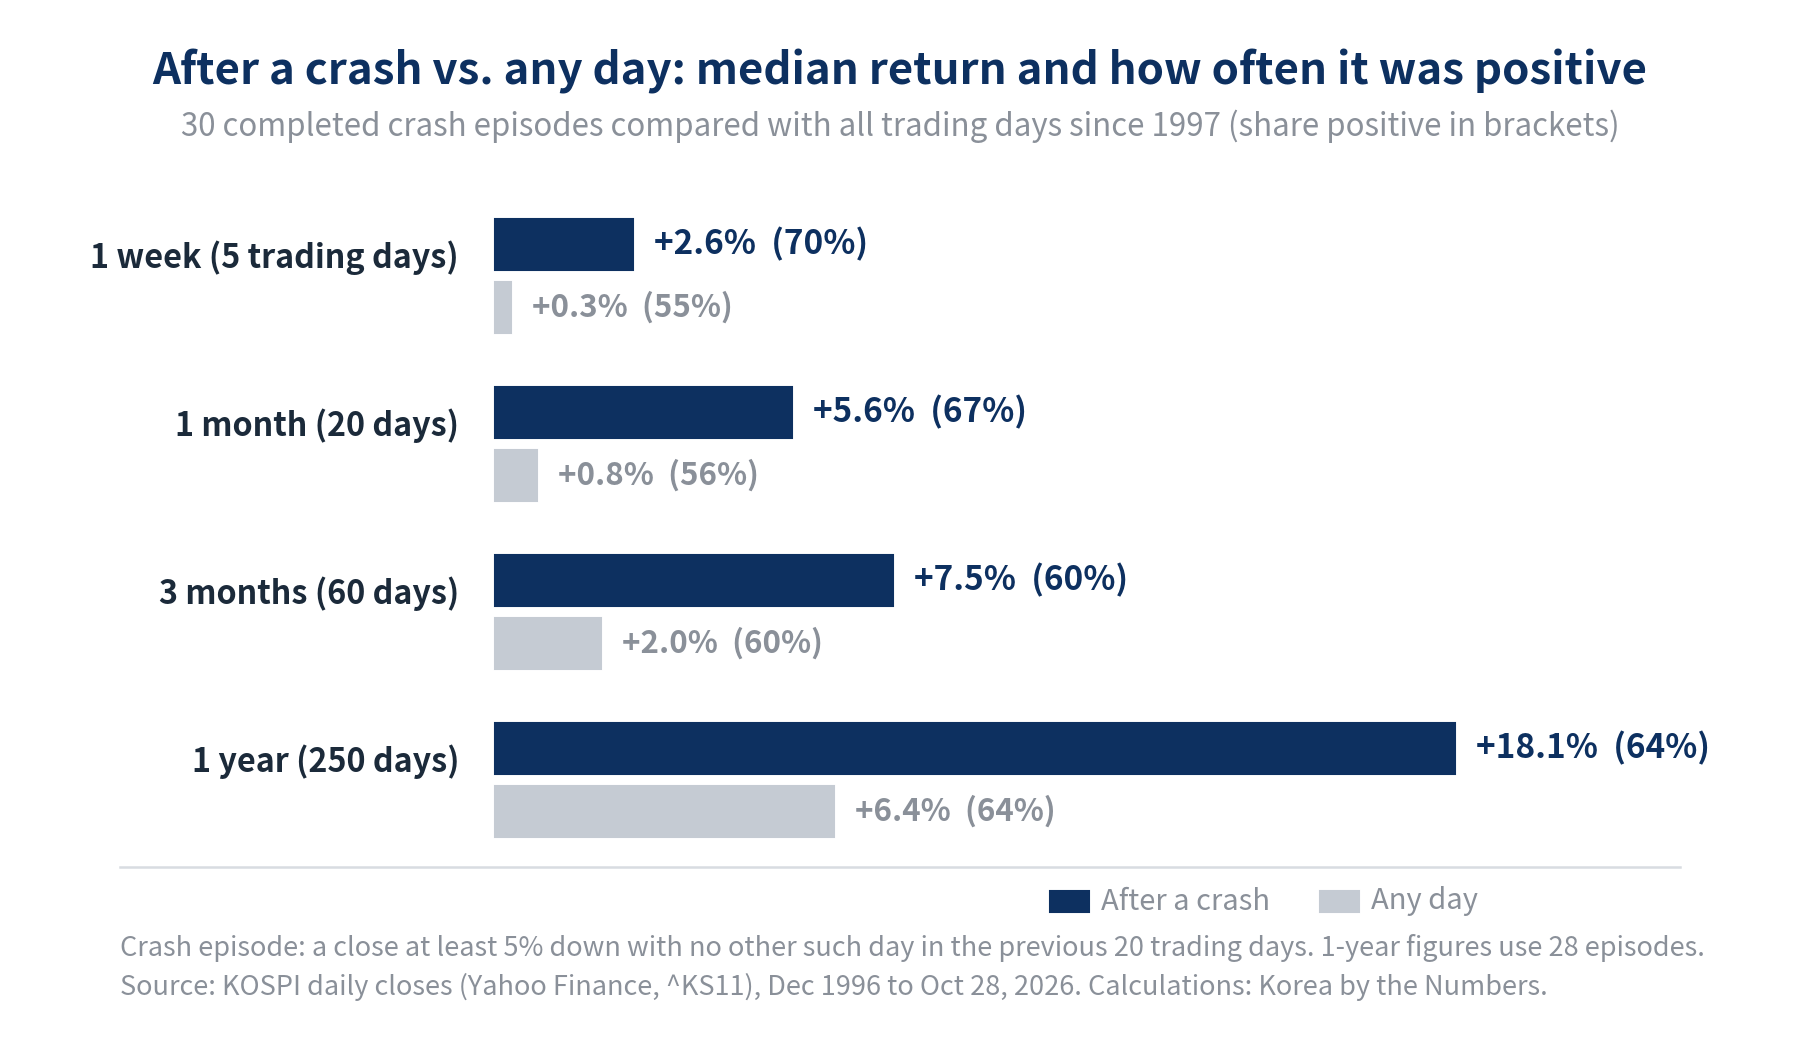
On the median, yes, at every horizon:
| Horizon | After a crash | Any day |
|---|---|---|
| 1 week | +2.6% | +0.3% |
| 1 month | +5.6% | +0.8% |
| 3 months | +7.5% | +2.0% |
| 1 year (28 episodes) | +18.1% | +6.4% |
The share of positive outcomes tells a different story. At one week and one month, the index was up after 70% and 67% of crash episodes, against 55% and 56% for an ordinary day, so short-term rebounds were common. At three months the gap is gone (60% vs 60%), and at one year it is 64% vs 64%.
In other words, one year after a crash the gains were larger than usual, but the odds of being up were no better than usual. When the index recovered it recovered strongly, and when it did not the losses were deeper. The middle half of one-year outcomes ran from -12.7% to +54.4% after a crash, against -6.0% to +24.1% for an ordinary day. The average one-year return after a crash (+32.1%) sits well above the median (+18.1%) because of a few huge rebounds: the 1998 crisis bottom (+172% and +197%), the 2020 pandemic low (+106%) and the April 2025 tariff shock (+167%).
All figures in this section are calculated from KOSPI daily closes. Medians of an even-sized sample are the average of the two middle values.
The crash day was rarely the bottom
In 25 of the 30 completed episodes, the KOSPI closed below the crash-day close at some point in the next 60 trading days. Across all 30, the median gap between the crash-day close and the lowest close of the next 60 days was -8.5% (-9.0% among the 25 that did go lower).
The crash day was the three-month low only five times: June 1999, October 2002, March 2020, August 2024 and February 2026. The deepest follow-through came after these crash days:
| Crash day | Further fall within 60 trading days |
|---|---|
| April 14, 1998 | -40.1% |
| October 24, 1997 | -38.6% |
| September 16, 2008 | -32.4% |
| July 24, 2000 | -30.5% |
| May 15, 2026 | -25.4% |
September 2008 is a useful example. Someone who bought on the crash day the day after Lehman Brothers filed for bankruptcy was up 19% a year later. But on the way there, the index fell another 32% within about six weeks. A positive one-year number can hide a very uncomfortable path.
One-year outcomes depended on the era
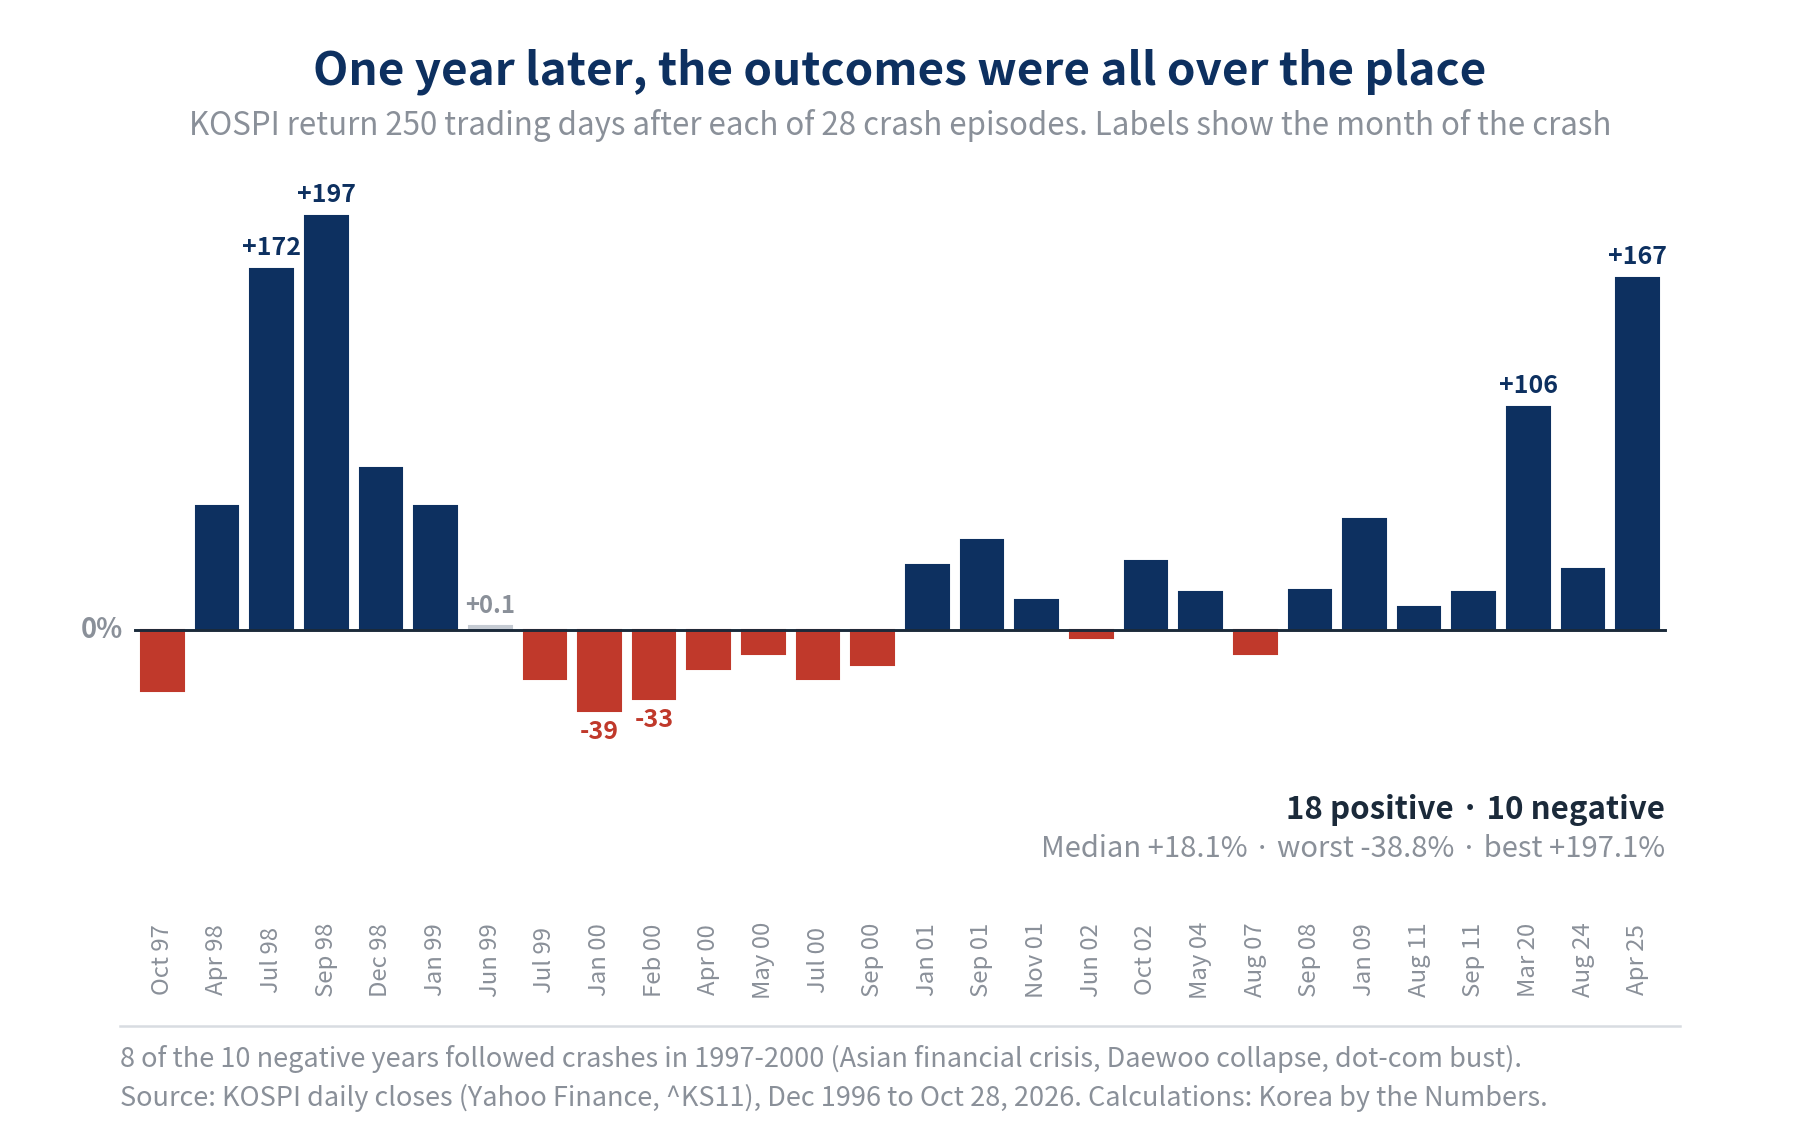
Taken one by one, the 28 measurable episodes produced 18 positive and 10 negative one-year returns. Eight of the ten negatives came from 1997 to 2000. October 1997 came just before the Asian financial crisis fully broke. July 1999 coincided with the liquidity crisis at the Daewoo Group. The six episodes of 2000 were stages of the long dot-com bust.
The four 1998 episodes, by contrast, were all followed by big gains, because the index had already collapsed and rebounded hard from its June 1998 low. What separated good outcomes from bad ones was whether the crash came at the start of a bear market or near its end. That is exactly what cannot be known on the day.
Since 2004 the record is better: 8 of 9 episodes were positive after one year, the exception being August 2007 (-11.2%). Nine observations are too few to treat that as a rule.
The best days came right after the worst ones
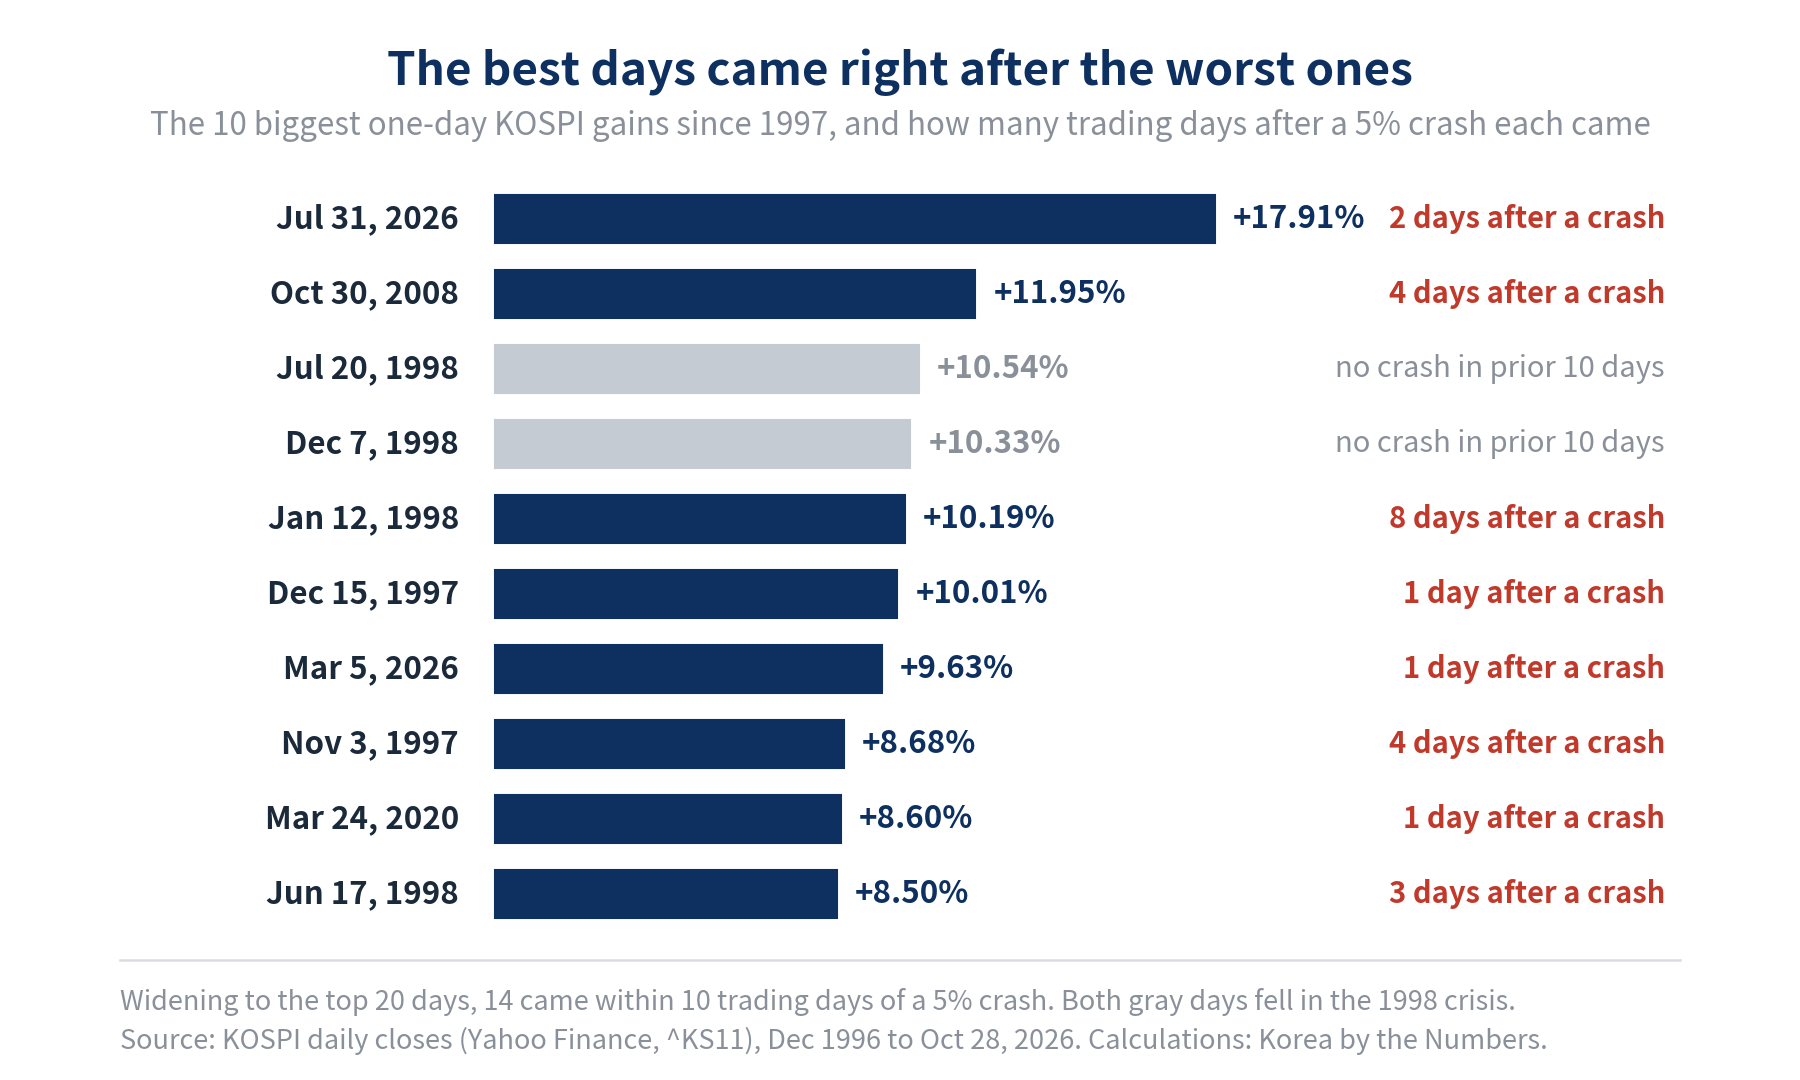
Of the 20 largest one-day gains since 1997, 14 came within 10 trading days of a 5% crash.
The largest, +17.91% on July 31, 2026, came two trading days after back-to-back falls of 10.84% and 5.98% on July 28 and 29. The second largest, +11.95% on October 30, 2008, came four days after a 10.57% crash. During the pandemic, +8.60% on March 24, 2020 came the day after a 5.34% fall.
Volatility rises in both directions at once. Selling in a panic on a crash day makes it easy to miss the rebound days that follow.
That does not make big rebounds a signal of a bottom. Ten of the top 20 days fell in 1997 and 1998, many of them in the middle of the decline. After the +10.01% rally on December 15, 1997, the KOSPI still fell another 27% to 280 by June 16, 1998.
What these numbers cannot tell you
- The sample is small. 30 completed episodes, 28 with a full year of data, and more than half of them from 1997 to 2002.
- The past may not repeat. 2026 is already unlike any earlier year in the number of crashes alone, and the market’s structure has changed, from the weight of a few semiconductor stocks in the index to the size of leveraged products.
- The index is not a portfolio. Individual stocks move far more than the index, and some never recover even when the index does.
- The numbers assume you held. A one-year return only counts if nothing forced a sale along the way. Borrowed money can be called in at the worst possible moment.
- This is the index in won. It excludes dividends and costs. For investors outside Korea, returns also depend on the won’s exchange rate, which can widen or narrow the result.
The bottom line
Thirty years of KOSPI crashes leave three findings.
First, the crash day was usually not the bottom. Five times out of six, a lower close came within three months.
Second, returns a year after a crash were larger than usual, but not more likely to be positive. The big recoveries were matched by years in which the index was still more than 30% lower.
Third, the best days tended to arrive right after the worst ones, and investors who sold in fear missed them.
The data does not say buy or sell. It says the outcome after a crash depended far less on the crash itself than on whether the investor could afford to stay invested through what came next.
Data: KOSPI daily closes from Yahoo Finance (^KS11), December 1996 to October 28, 2026. Where early years have missing sessions, daily changes are calculated between consecutive available closes. All counts, returns and percentages are our own calculations from this series. Past returns do not guarantee future results.